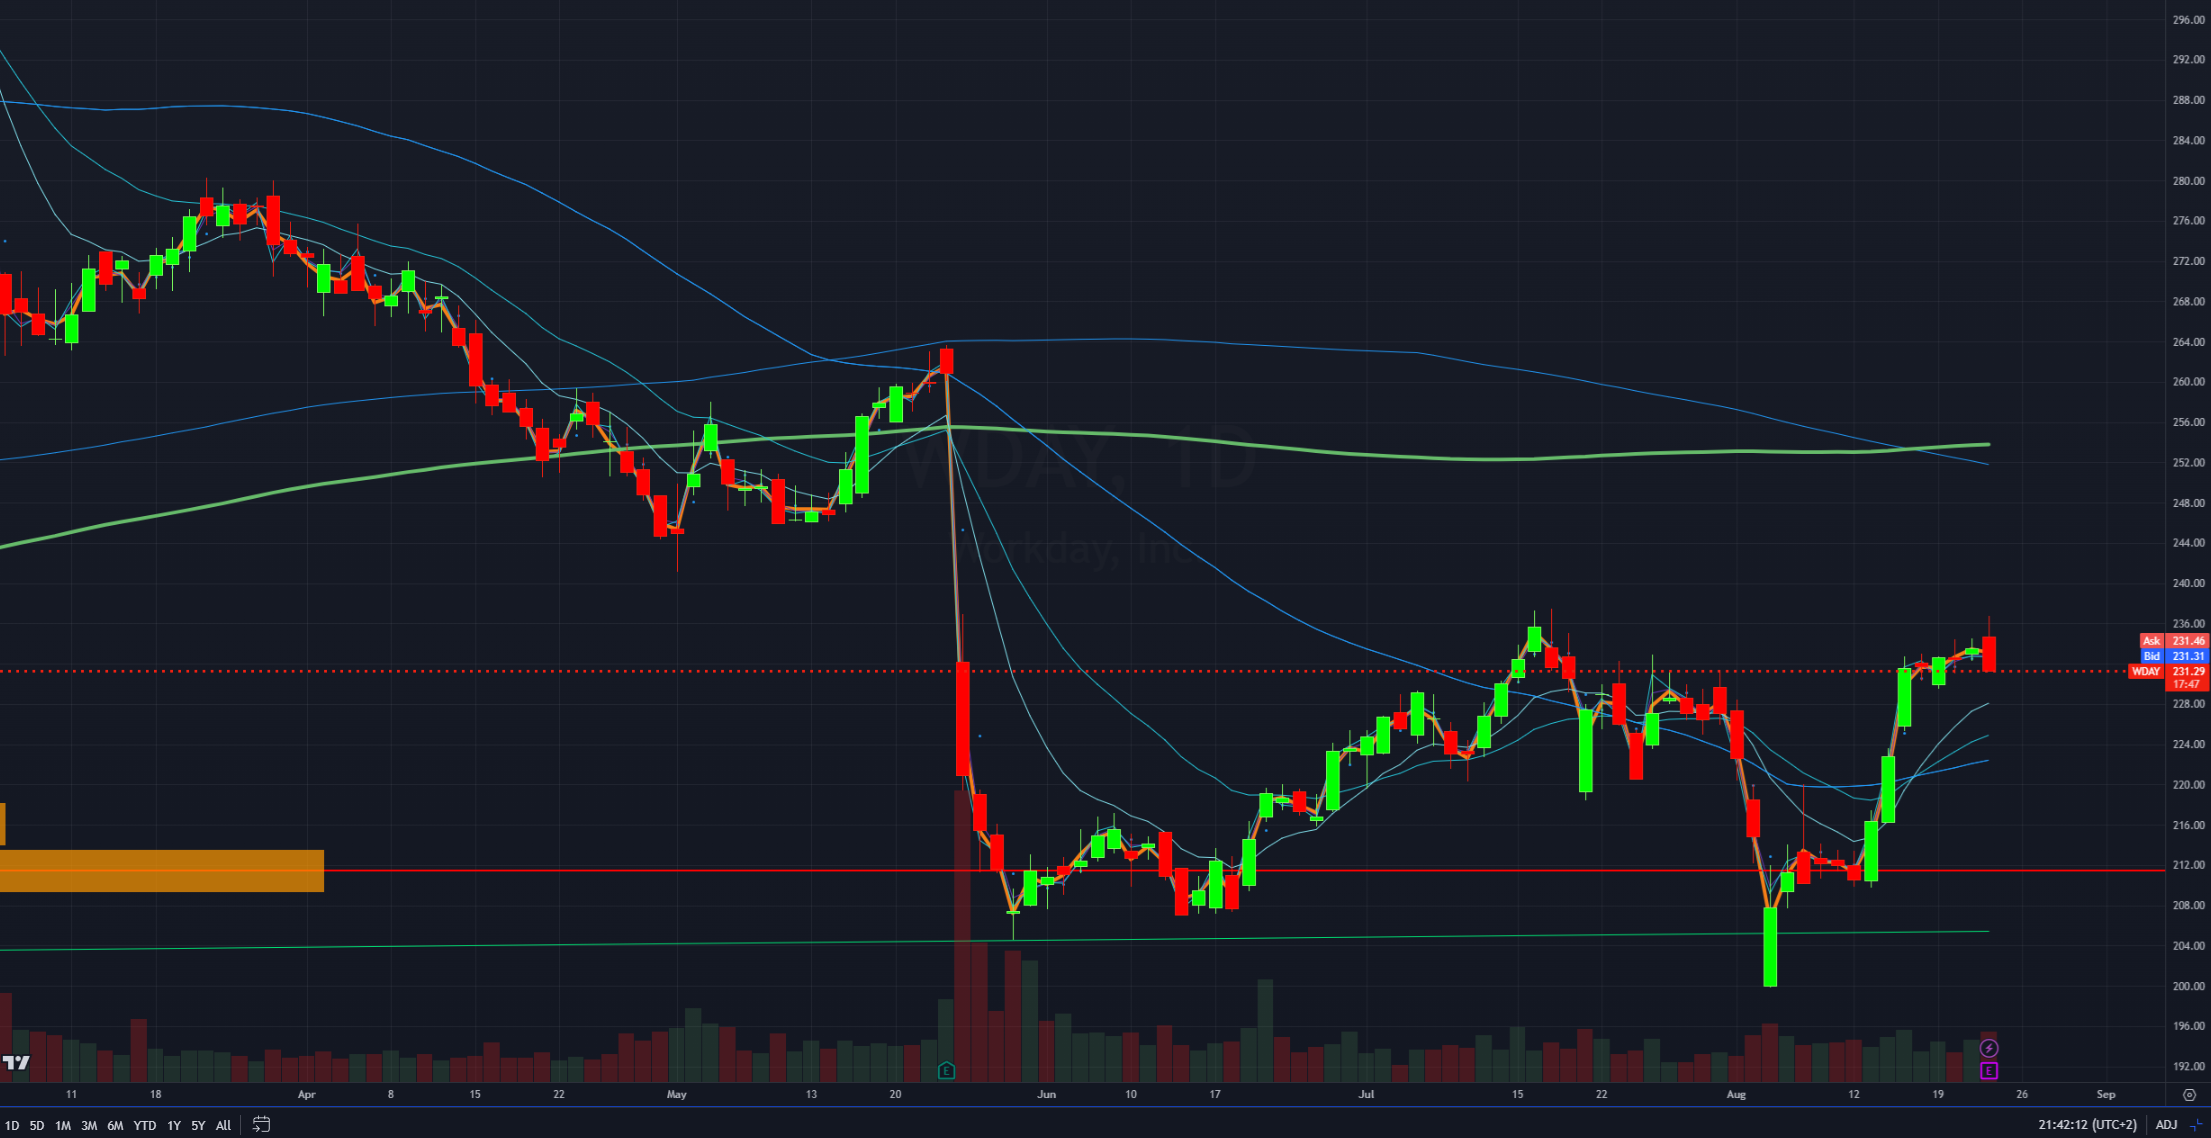
Market Sentiment towrad Workday Inc.
Workday Inc. (WDAY) competes robustly in the enterprise cloud applications space against SAP by leveraging its native cloud architecture and focus on innovative, user-friendly solutions. Despite SAP’s broad product offerings and strong customer retention derived from its long-standing presence in the market, Workday has made significant inroads, particularly with mid-sized to large enterprises undergoing digital transformations. Market sentiment toward Workday is generally positive due to its consistent growth, innovative product development, and ability to secure new customers, though SAP’s comprehensive solutions and massive R&D investments represent ongoing competitive challenges. The dynamic between the two reflects broader technology trends, where agility and innovation meet the depth and breadth of established functionality.
Current Financial Metrics for WDAY
Looking at current financial metrics for WDAY, here are some of the positive indicators:
Forward P/E Ratio (29.36) - While this might seem high relative to some benchmarks, it indicates market expectations of earnings growth, which could be seen as a positive if investors believe in the company’s future growth prospects.
EPS Growth Next Year (15.39%) - This suggests a strong forecast for earnings growth next year, indicating potential future profitability and a positive outlook.
Current Ratio (1.95) - A current ratio above 1 suggests that WDAY can cover its short-term liabilities with its short-term assets more than once, which is a good indicator of financial health.
EPS Surprise (8.59%) - WDAY has recently reported earnings that were 8.59% higher than what analysts expected, which is a strong positive and can lead to increased investor confidence and potentially a higher stock price.
Sales Growth (Q/Q 18.83% and Y/Y 16.80%) - Both quarterly and yearly sales growth are robust, indicating that the company’s products or services are in increasing demand.
Return on Equity (ROE 21.09%) - This is a relatively high ROE, suggesting that WDAY is effective at generating income from its new investment capital.
These positive factors suggest that WDAY is performing well in several key areas, which might be attractive to investors looking for growth and strong financial health in a company.
Here are two negative indicators:
Price to Book Ratio (P/B - 7.55) - This ratio is quite high, which can suggest that the stock is overvalued relative to its book value. A higher P/B ratio might indicate that the stock price is relatively expensive compared to the actual net assets of the company, which can be a negative signal for value investors.
Stock Performance Year-To-Date (Perf YTD -15.77%) - The stock has underperformed this year, showing a significant decline in its price. This negative performance might reflect investor concerns about the company’s future prospects or broader market conditions affecting the stock.

Gap Analysis
There is a noticeable gap on daily chart between May 25 and May 26. This gap formed when the price jumped upwards from one trading day to the next without any trading occurring in between. This type of gap is often referred to as a “breakaway gap,” which may occur at the end of a price pattern and signify a new move in the direction of the gap.
Filling the Gap: Gaps are often expected to be “filled” in technical analysis, which would mean the price returning to the original level before the gap occurred. However, not all gaps are filled, and breakaway gaps, in particular, may indicate a strong move in a new direction that might not reverse. Given the subsequent price action which continues above the gap level, this gap might not fill in the near future.
Technical Indicator Analysis
Moving Averages
The chart includes a 200-day (green), 50-day (blue), and 20-day (grey) moving average. The recent crossing of the 20-day moving average above both the 50-day and 200-day averages is a bullish signal, often referred to as a “Golden Cross,” suggesting potential ongoing upward momentum.
Volume Profile
The volume bars on the left indicate significant trading activity at certain price levels. The highest volume nodes can act as support or resistance. The area around $240 has a high volume node, indicating strong support or resistance at this level.
Current Price Action and Future Outlook
Current Trend
The stock appears to be in an uptrend as indicated by the upward trajectory post the significant gap and the moving averages configuration. The recent candles are above all three moving averages, reinforcing this bullish outlook.
Resistance and Support Levels
Immediate support is likely near the $240 mark where the high volume node is observed. Resistance could be expected near the recent highs around $255.