Let’s analyze Intel Corporation (INTC) based on the technical, news, fundamental and option chain:
Technical Analysis
Trend:
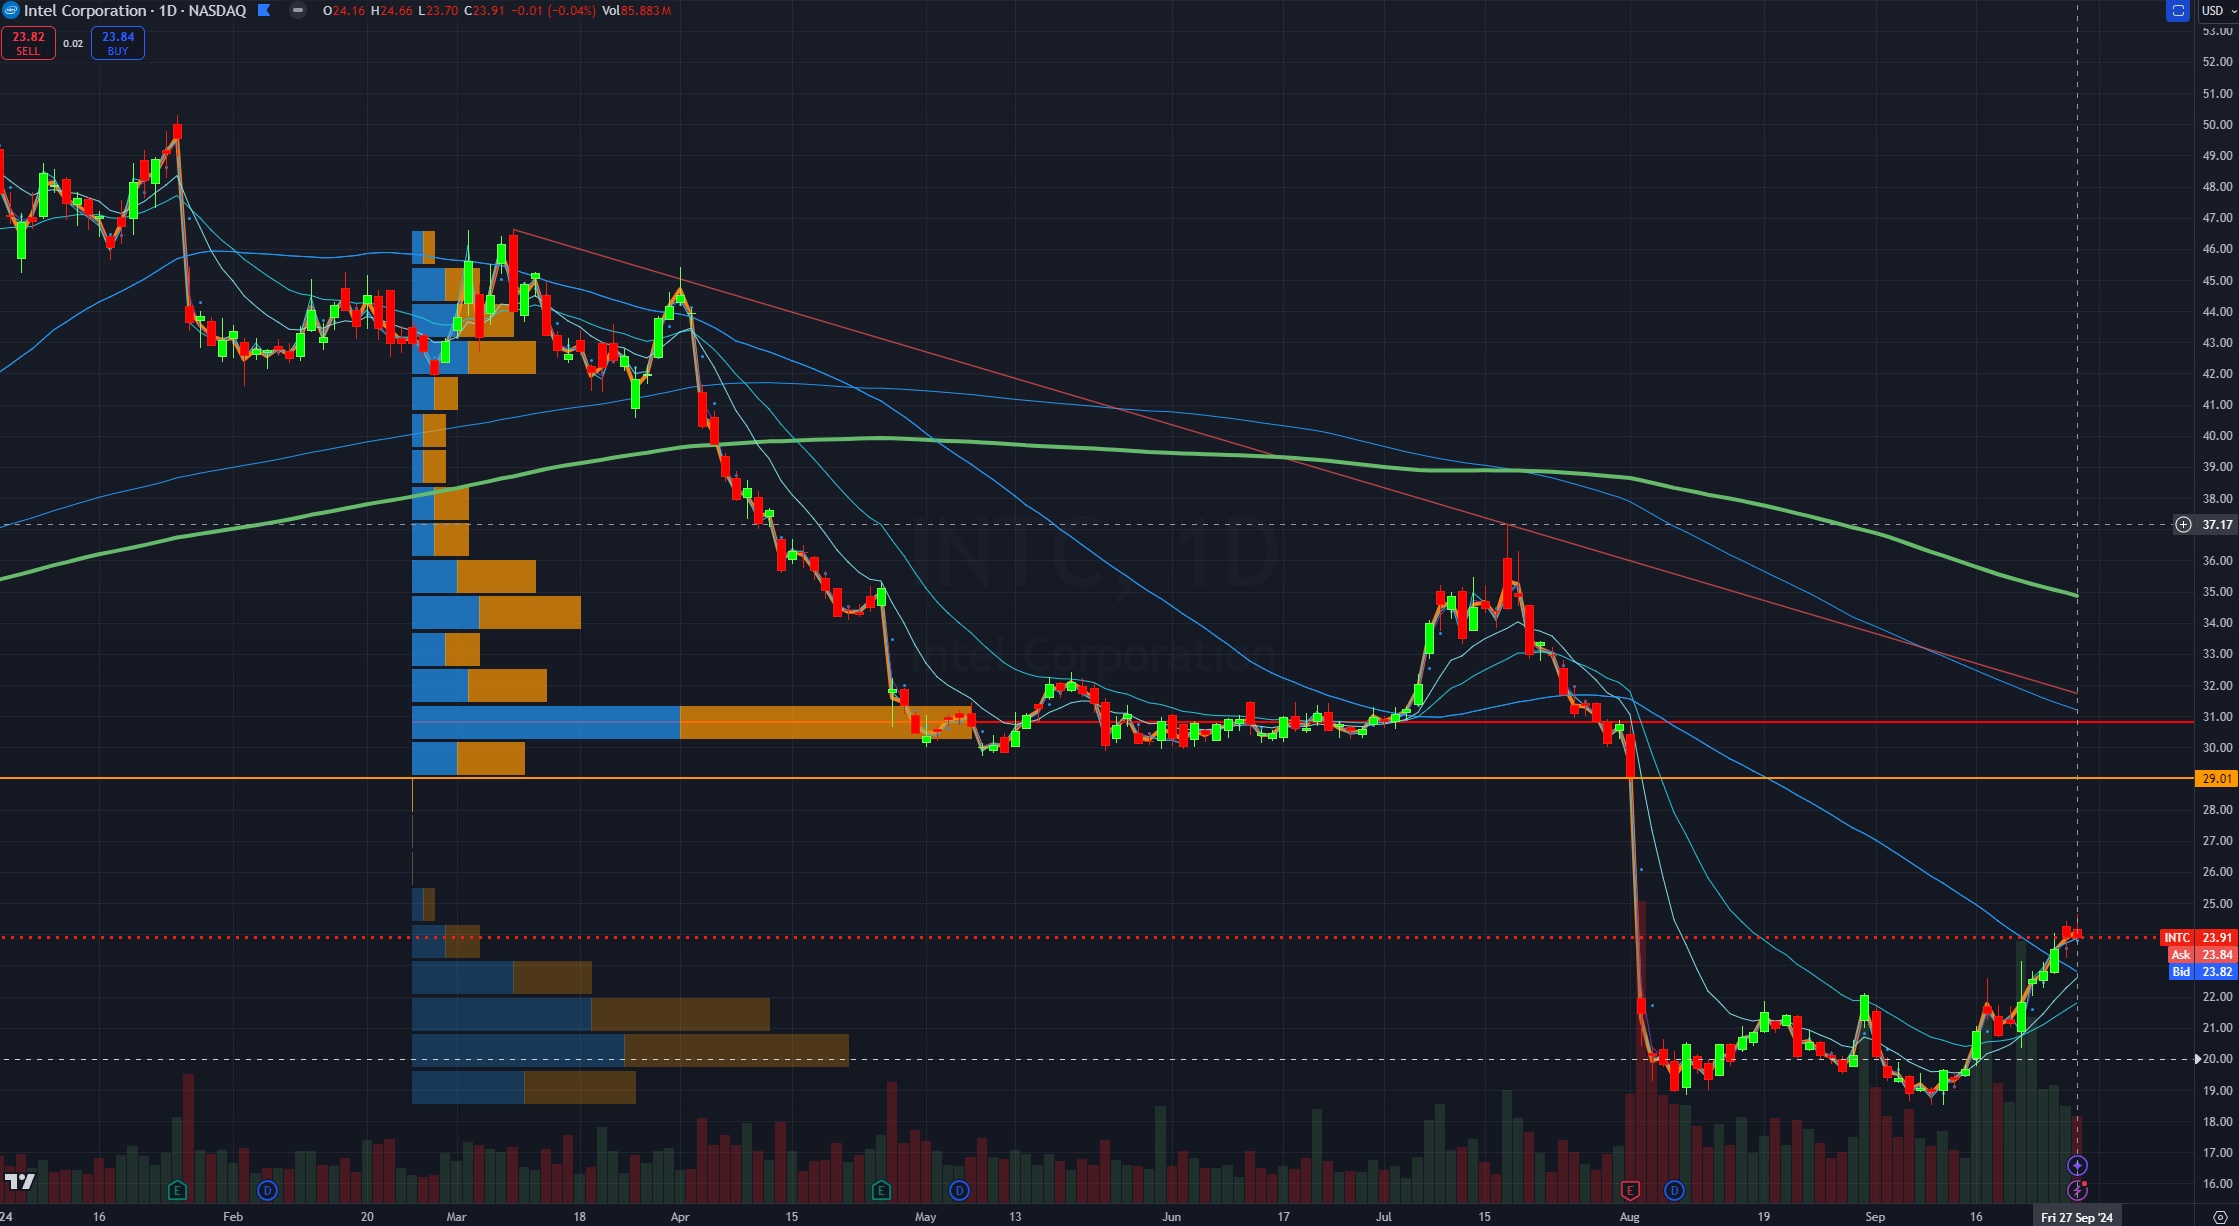
INTC has been in a downward trend since the highs around $52. Recently, the stock appears to have bounced from a low near the $19-$20 area and is currently trading near $23.91.
Support and Resistance:
Resistance: There is a clear resistance near the $29 level, where the price had previously reversed multiple times. This could serve as a significant barrier for upward movement.
Support: Strong support seems to be located around the $20 level, which coincides with previous lows and the volume profile cluster. This is also the zone where the price reversed recently.
Volume Profile:
The Volume Profile shows a heavy concentration of trading around the $27-$28 range, indicating strong interest and potential resistance around those levels. This suggests that price might struggle to break above these levels in the short term.
Moving Averages:
The price is trading below several major moving averages, such as the 200-day moving average (green) and 100-day moving average (red). This indicates the stock is still in a broader bearish trend. The shorter-term moving averages (possibly 20-day and 50-day) are turning upward, which could signal a potential bullish reversal if the price can maintain this momentum.
Volume:
Volume has been relatively high around the $22-$25 zone, which supports the idea that accumulation or short covering could be occurring here.
Bullish Scenario:
If INTC can break above the resistance at $25-$27 with high volume, it may retest the $29-$30 range. A break above $30 could signal a more significant reversal of the downtrend.
Bearish Scenario: Failure to hold current levels could lead to a retest of the $20 support, and if broken, further downside could take the stock lower towards recent lows.
Summary: INTC is showing some signs of recovery from its recent downtrend but still faces significant resistance levels. Traders should watch the $25-$27 zone closely for signs of either a breakout or rejection to gauge the next move.
Possible Patterns Identified:
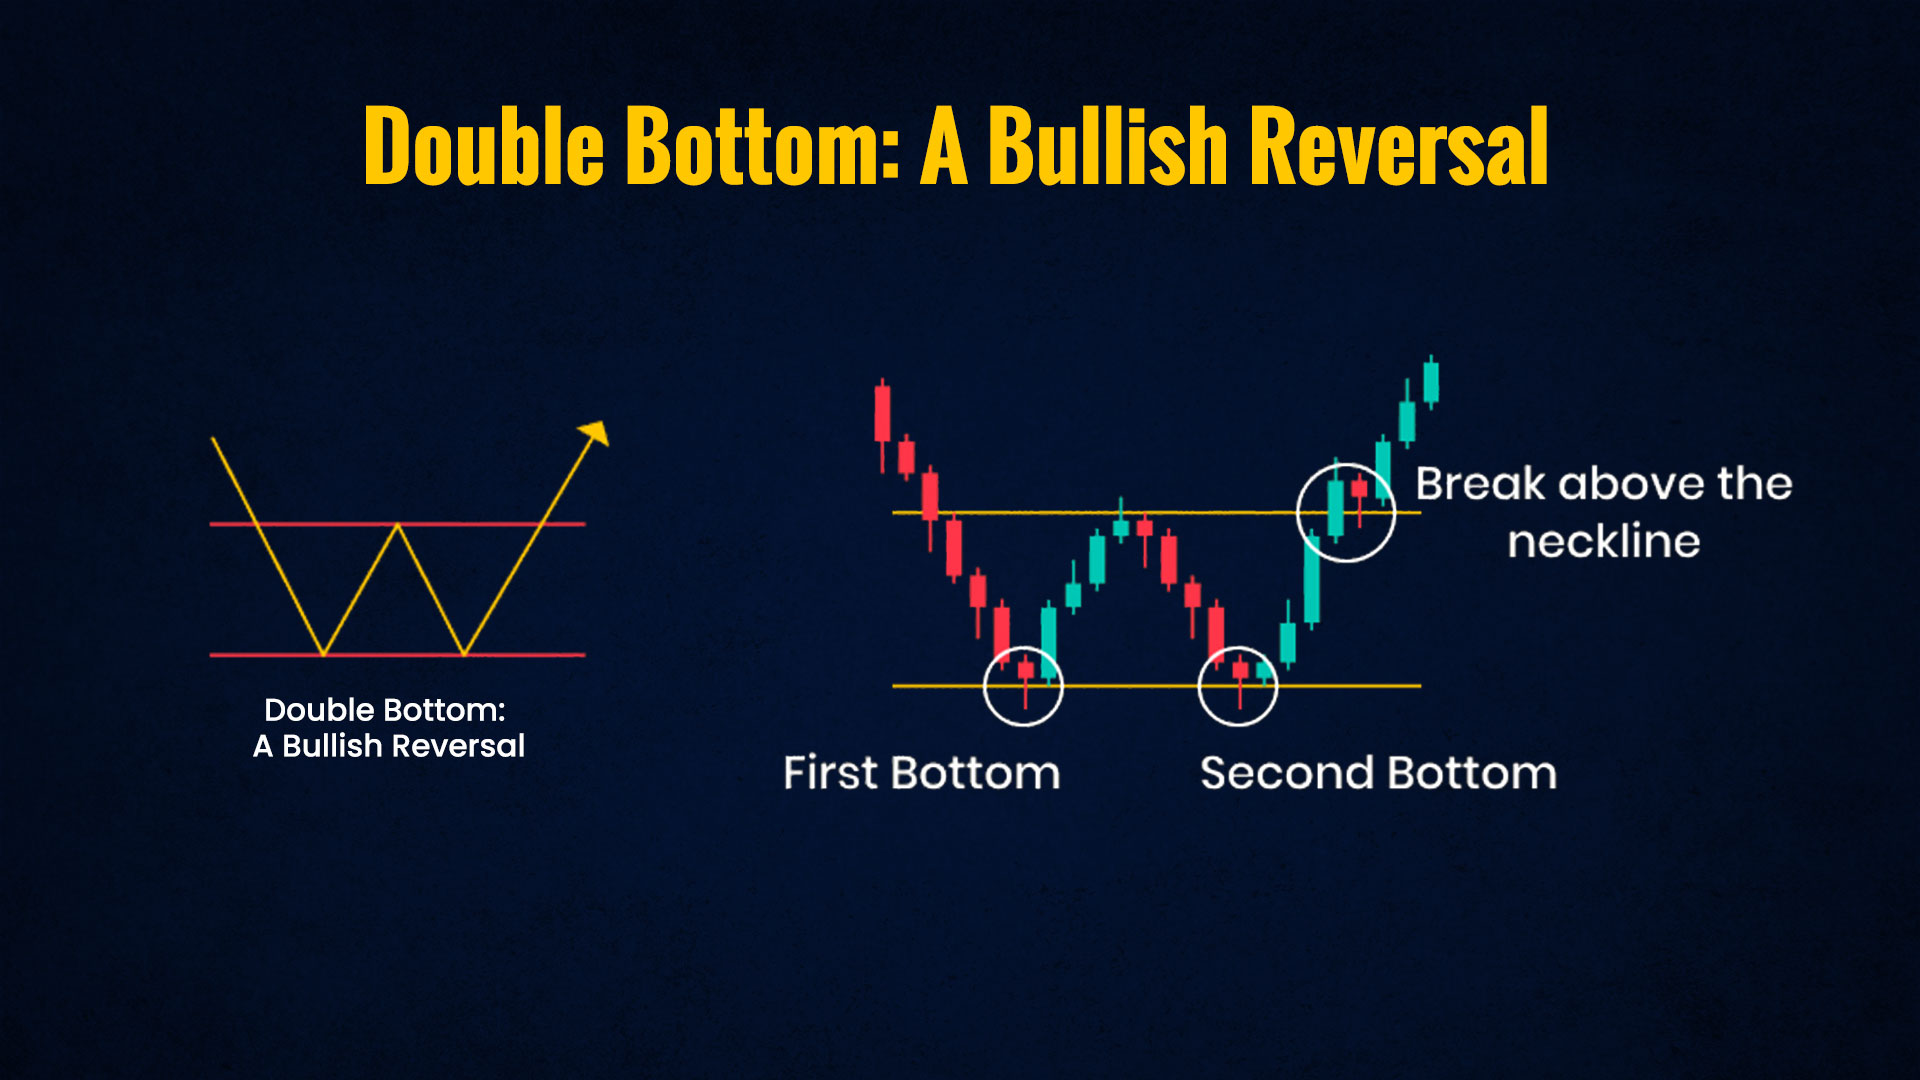
Double Bottom (Bullish Reversal Pattern):
Formation: The chart shows what could be interpreted as a Double Bottom pattern, a classic bullish reversal pattern. This occurs after a significant downtrend when the price hits a low, rebounds, and then tests that low again before rebounding higher.
Location: The pattern appears to have formed around the $25-$26 price level. The stock dipped down to this level twice, once in May and then again in August, with the price bouncing off that level, indicating strong support.
Breakout Potential: A confirmed breakout above the $29 level would confirm this pattern, potentially signaling a bullish reversal with more upside ahead.
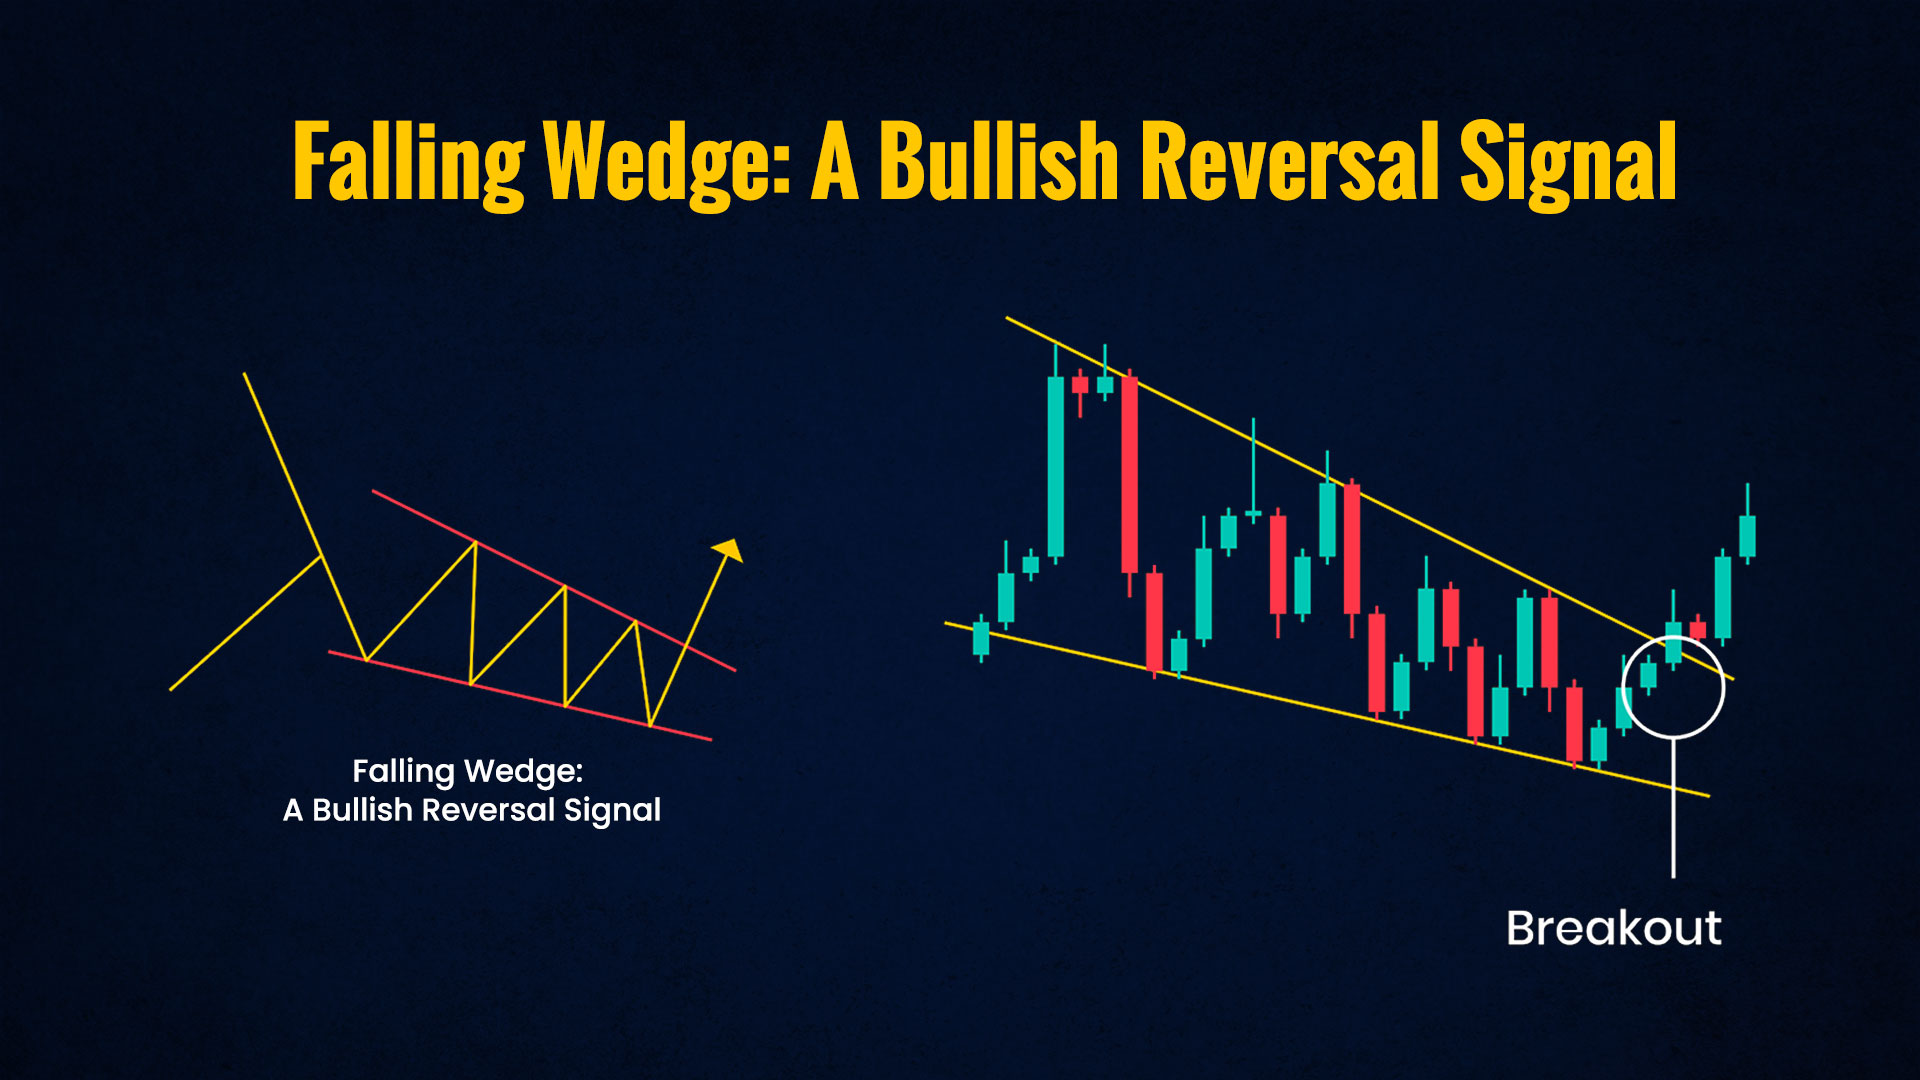 Falling Wedge (Bullish Reversal Pattern):
Formation: A falling wedge pattern could also be forming. This is a bullish pattern that suggests a narrowing range of prices following a downtrend and indicates that the selling pressure is weakening. Characteristics: The price has been making lower highs and lower lows since April, but the range is tightening. The declining trendlines suggest that a breakout could be approaching soon.
Trigger Point: A breakout above the $24-$25 level on strong volume could trigger a breakout from the wedge, implying a potential rally back toward $30 and beyond.
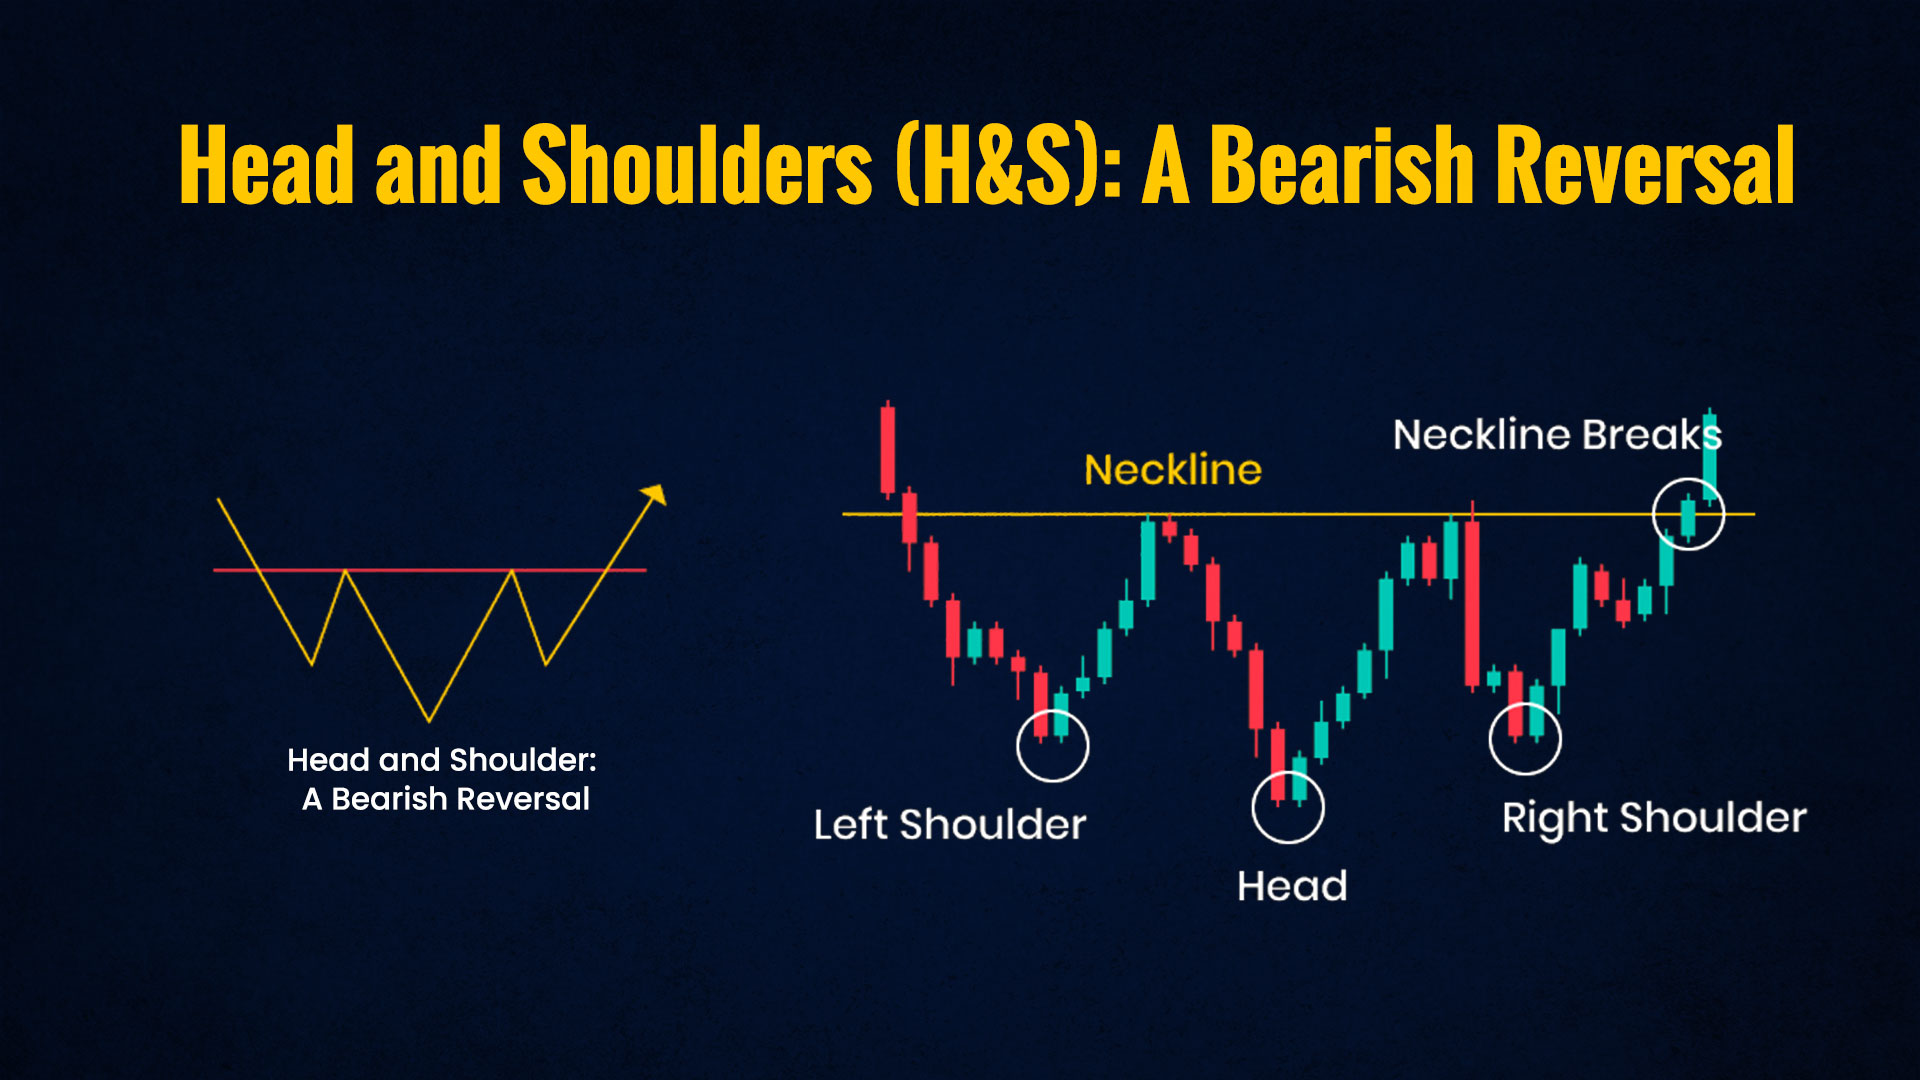
Head and Shoulders (Bearish Pattern) Inverse:
Formation: Another possibility is an Inverse Head and Shoulders pattern, which is a bullish reversal pattern that typically appears at the bottom of a downtrend. It consists of three troughs, with the middle trough (head) being the lowest, and the two shoulders being higher on either side.
Location: The left shoulder might be around March-April, the head could be the June-July low, and the right shoulder might have formed more recently around the August-September period.
Neckline: The neckline of this pattern could be around the $27-$28 zone. If this level is broken convincingly, it would confirm the bullish reversal pattern, and the stock could rise towards higher resistance levels.
Bullish Patterns: The Double Bottom, Falling Wedge, and Inverse Head and Shoulders all suggest potential bullish reversal scenarios. However, confirmation of these patterns would require a breakout above key resistance levels—especially the $27-$29 area on strong volume.
Key Level to Watch: $27-$29. If the stock breaks this level, these bullish patterns could be confirmed, leading to a possible move higher.
Option Chain Analysis:
Let’s analyze the option overview for Intel Corporation (INTC) based on the information provided in the image.
Key Metrics Breakdown:
Implied Volatility (IV):
Current IV: 55.60% — This is relatively elevated compared to its historical volatility (58.97%) and the IV percentile of 98%, suggesting that options are currently priced with high expectations of future volatility.
IV Rank: 83.29% — This indicates that the current IV is higher than 83% of past observations, meaning the market is expecting significant movement in the stock. Elevated implied volatility often precedes larger price moves.
Put-Call Ratios:
Volume Put-Call Ratio: 0.35 — A ratio below 1.0 indicates that there are more call options being traded compared to put options. In this case, 0.35 is quite low, suggesting a significant bullish sentiment, as traders are more inclined to buy calls in anticipation of a rise in the stock.
Open Interest Put-Call Ratio: 0.62 — Although not as bullish as the volume put-call ratio, this still leans slightly bullish. A value below 1 implies more open interest in call options compared to put options, suggesting that the overall options market anticipates a potential upward move.
Option Volume:
Total Volume: 511,065 contracts traded, which is 96.26% of the average daily volume. This shows that there’s significant activity in the options market, with the majority of the trades being calls (377,206) compared to puts (133,859). This further reinforces the bullish sentiment reflected in the volume put-call ratio.
Open Interest:
Total Open Interest: 4,750,090 contracts.
Call Open Interest: 2,927,564 contracts.
Put Open Interest: 1,822,526 contracts.
Summary: The open interest put-call ratio of 0.62 indicates that more traders are holding bullish call positions than bearish put positions. This is a neutral to slightly bullish indicator, suggesting that the existing positions in the market favor upward movement.
Based on this options overview, bullish sentiment is dominant. The low volume put-call ratio of 0.35 and the higher call open interest indicate that traders are positioning for potential upside in the stock. Elevated implied volatility also suggests that the market is anticipating significant price movement in the near future, which, combined with the bullish options positioning, could signal optimism for a positive price move.
However, it’s essential to note that implied volatility can lead to significant price swings in either direction, and high IV often implies uncertainty. Despite this, the strong call buying relative to puts, along with the moderately bullish open interest put-call ratio, gives this setup a bullish bias.
Recent News:
Recently, there have been reports of interest from both ARM and Qualcomm in acquiring parts of Intel’s business. ARM reportedly approached Intel with a high-level inquiry to buy its product division, which focuses on PC, server, and networking chips. However, Intel rejected the offer, signaling that its core product business wasn’t up for sale. Qualcomm also expressed interest in a potential takeover of Intel’s design operations, particularly the PC design unit, though this too seems speculative at this point. Such acquisitions would be monumental but would also face significant regulatory scrutiny, especially due to antitrust concerns.
In addition to these acquisition rumors, Intel has been strengthening its partnerships, including a deal to manufacture chips for Amazon and Qualcomm. This partnership is part of Intel’s strategy to revitalize its foundry business and catch up with competitors like TSMC. These collaborations suggest that Intel is trying to leverage its manufacturing capabilities to regain footing in the competitive chip industry.
Sell the News, Buy the Rumor? In financial markets, the saying “buy the rumor, sell the news” refers to a common market phenomenon where speculation about future events drives stock prices up, but once the event materializes, there is often a sell-off. In this case, the rumors of acquisitions by ARM and Qualcomm have sparked bullish sentiment in Intel’s stock. However, because Intel has reportedly rebuffed these offers, the reality might not live up to the initial excitement, which could cause a pullback in stock price. Nevertheless, the ongoing partnerships with Amazon and Qualcomm for chip manufacturing are concrete positive developments, potentially keeping sentiment bullish.
Overall Sentiment: The acquisition rumors can be seen as bullish in the short term, as they indicate that competitors see value in Intel’s assets, even as the company faces challenges. The partnerships with Qualcomm and Amazon for chip manufacturing further support a bullish longer-term outlook, as these deals could help Intel regain market share in the semiconductor industry. However, the lack of finalized deals and Intel’s current struggles suggest a cautious approach is warranted.
Fundamental Data
Positives:
Strong Earnings Growth Forecast:
EPS Next Year (EPS Growth): The expected earnings per share (EPS) growth for next year is 300.95%, indicating that Intel’s earnings are projected to rebound significantly in the upcoming year. This shows optimism for future profitability.
Cash Reserves and Dividends:
Cash per Share: Intel has $6.85 per share in cash reserves, providing it with financial flexibility. Dividend Yield: Intel has a 2.09% dividend yield, which is attractive for income-seeking investors. Despite recent troubles, it still manages to return cash to shareholders.
Book Value and P/B Ratio:
Book Value per Share: Intel’s book value per share is $26.95, which is above its current price of $23.91, suggesting that the stock is potentially undervalued.
P/B Ratio: The Price-to-Book ratio (P/B) is relatively low at 0.89, further supporting the idea that the stock may be trading below its intrinsic value.
Negatives:
Poor Earnings Performance in the Recent Past:
EPS This Year: Intel’s earnings per share (EPS) have dropped -73.69% this year, showing a sharp decline in profitability.
EPS Surprise: The company delivered an EPS surprise of -80.16%, which suggests that Intel has significantly underperformed compared to analysts’ expectations.
Declining Sales: Sales Growth: The sales growth for the last quarter (Sales Q/Q) is -0.90%, indicating that revenue is shrinking, which is a bearish sign for future growth.
Sales Surprise: Intel reported a sales surprise of -0.69%, further reflecting that the company is struggling to meet expectations.
Stock Performance:
Performance Year to Date (Perf YTD): Intel’s stock has declined -52.42% year-to-date, showing significant weakness and loss of investor confidence. SMA 200: The stock is trading 31.62% below its 200-day moving average, indicating a strong downward trend and technical weakness.
Overall Sentiment: Neutral to Slightly Bearish
While Intel has positive future earnings growth prospects and maintains a healthy cash position with attractive dividends, its poor recent performance in earnings, declining sales, and significant stock underperformance point to caution. Intel’s fundamentals show potential for recovery, but the company is still in a difficult spot, which makes the outlook neutral to slightly bearish unless it can effectively turn things around with its future growth initiatives.
Overal Outlook:
Intel (INTC) shows a mixed outlook: While technical analysis highlights potential bullish reversal patterns and bullish sentiment in the options market (with a low put-call ratio and strong call volumes), the fundamentals present challenges with declining sales, poor recent earnings, and significant stock underperformance. Despite optimism from future growth projections and partnerships, the overall sentiment remains neutral to slightly bearish, pending confirmation of a sustained recovery in earnings and stock performance.
