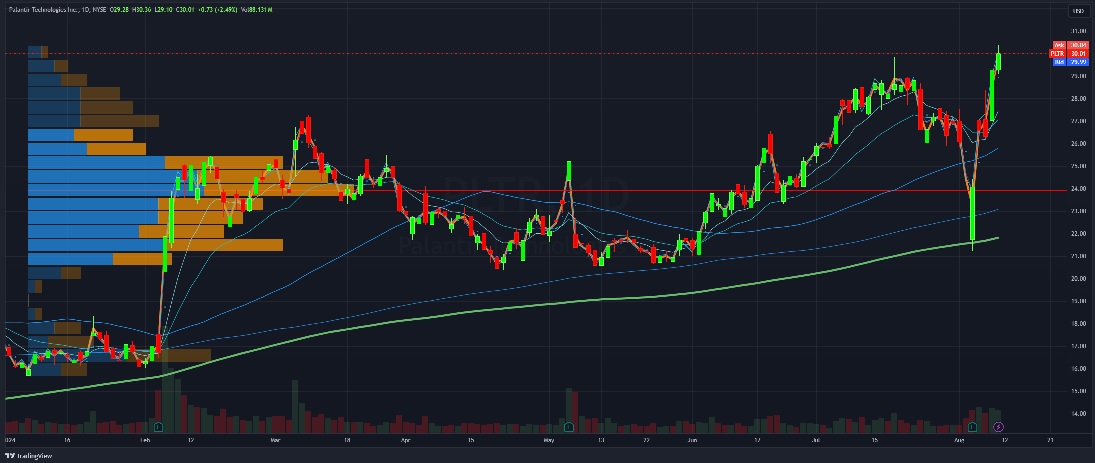
What’s happened recently?
Recently, Palantir Technologies (PLTR) has experienced significant growth in its stock price, largely fueled by its robust performance in artificial intelligence (AI) and strategic partnerships with the U.S. government. The company reported a notable 65% surge in stock value in 2024, driven by its advanced AI platform and a substantial increase in its customer base. Additionally, Palantir’s impressive second-quarter earnings exceeded expectations, prompting them to raise their revenue and profit forecasts for the year. This upward trajectory reflects the company’s expanding influence and success in integrating AI solutions into both commercial and governmental sectors.
5 Facts about Palantir Technologies’ financial health:
-
Strong Sales Growth: Palantir’s sales have shown a significant uptick, recording $2.48 billion in total revenue.
-
Profit Margin: The company maintains a healthy profit margin of 16.32%, indicating efficient management of operational costs relative to revenue.
-
Consistent Earnings Surprises: Palantir has consistently surpassed earnings expectations, with an EPS surprise of 11.80% in the latest quarter.
-
Impressive Stock Performance: Over the past year, Palantir’s stock has seen a remarkable increase of 96.79% in its price.
-
Robust Liquidity Ratios: The company’s quick and current ratios are both at 5.92, reflecting strong liquidity and the ability to cover short-term obligations without relying on the sale of inventory.
Year-To-Date (YTD) daily performance of Palantir Technologies (PLTR)
1- Volume Spike and Recovery: There’s a noticeable volume spike accompanied by a sharp price increase, indicating strong buying interest that may suggest a bullish sentiment among investors.
2- Moving Averages: PLTR has moved above several key moving averages (including the 50-day and 200-day MAs), which typically signal a strong bullish trend.
3- Support and Resistance Levels: The chart shows clear support and resistance levels, with recent price action testing these boundaries. The price has recently rebounded from a strong support level, suggesting resilience in the stock price.
4- Bollinger Bands: The stock price has touched the upper Bollinger Band, which often acts as a dynamic resistance level. This could imply a potential pullback or consolidation might follow.
5- Overall Trend: The overall trend since February appears to be bullish, with higher highs and higher lows, indicative of a strong upward momentum.
