Financial Weak Points:
Current Ratio:
Current Ratio (0.89) below 1 suggests that the Starbucks may have difficulty meeting its short-term obligations. This could indicate liquidity issues. Also, Starbucks’ current ratio is below the industry average. This suggests that Starbucks has less liquidity than its peers in the same industry. In addition, current ratio has declined compared to its historical values. This implies that the company’s liquidity has weakened over time relative to its past performance.
Recent News:
Leadership Changes:
Starbucks recently announced that Brian Niccol has been appointed as the new Chairman and Chief Executive Officer, starting from September 2024. Niccol’s appointment comes at a time when the company is facing various challenges globally, including declining sales in key markets like China.
Activist Pressure:
The company is under significant pressure from activist investors like Starboard Value and Elliott Management, who are pushing for strategic changes to boost shareholder value. These investors are advocating for potential measures such as selling off the China business or increasing dividends. The company’s stock has been fluctuating amid these developments (InvestorPlace).
Sustainability and Store Redesigns:
Starbucks has been making strides in its sustainability efforts, aiming to reduce its carbon, water, and waste footprints by 50% by 2030. The company is also redesigning its stores to be more accessible and environmentally friendly, with a target of opening 640 newly designed stores in the coming year. Additionally, Starbucks is on track to reach its goal of 10,000 Certified Greener Stores by 2025 (CoffeeTalk).
Challenges in International Markets:
Starbucks is experiencing difficulties in international markets, particularly in China, where sales have dropped by 11% in the latest quarter. The company is also dealing with geopolitical tensions and competition from local brands. These challenges have prompted discussions among investors and management about potential strategic shifts in these key.
Technical Analysis:

Price Action
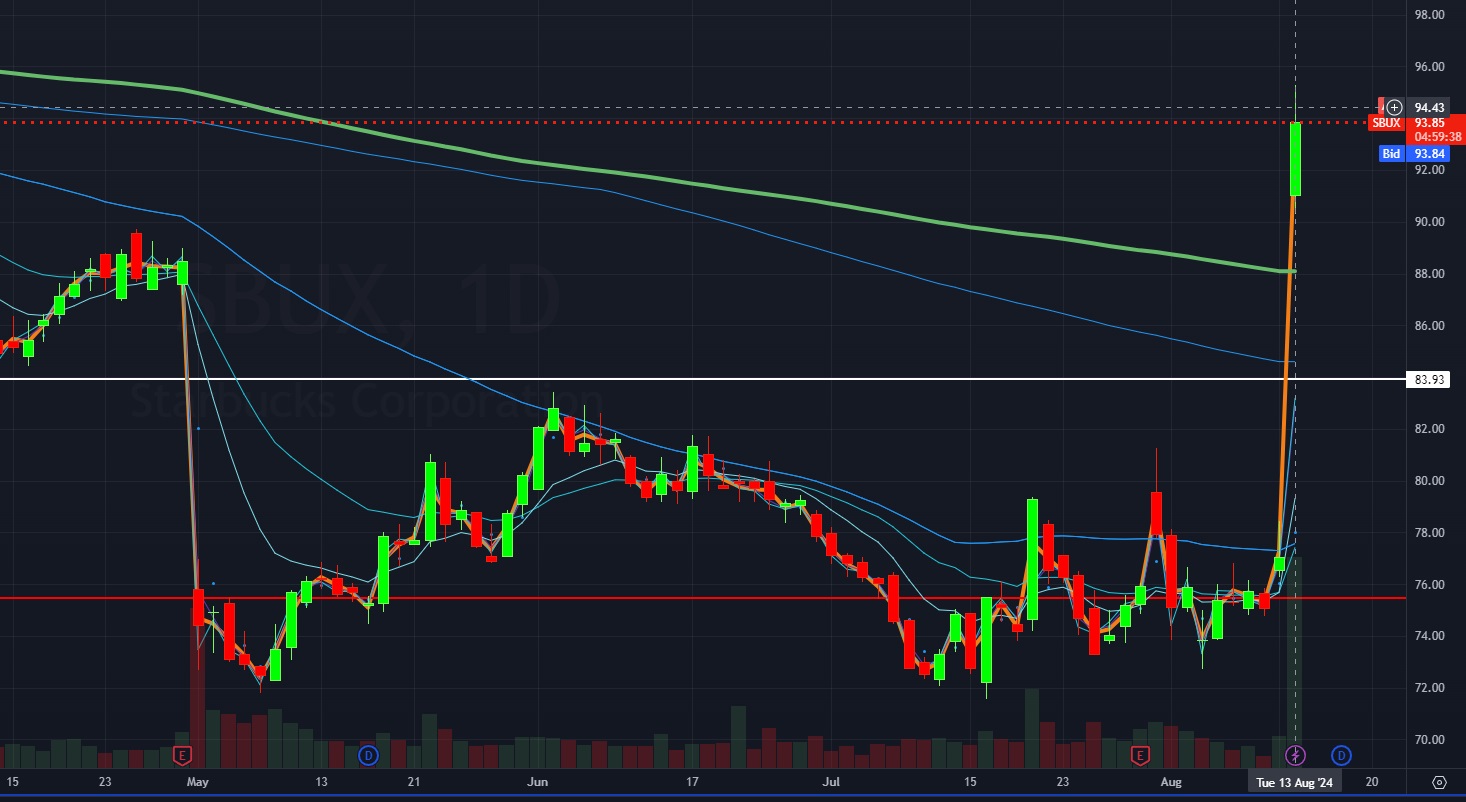
The chart shows a significant upward move with a large green candle, indicating a strong bullish trend. This move likely represents a breakout from a previous resistance level. The price has jumped from around $83.93 to over $94, marking a substantial gain.
Moving Average:
The recent price action has caused the stock to break above these moving averages, which is typically a bullish signal.
Volume Profile:
The volume bars at the bottom of the chart indicate a significant increase in trading volume, particularly during the breakout, confirming the strength of the move.
Resistance and Support Levels:
The chart indicates a previous resistance level around $83.93, which the price has now broken through. This level may now act as support. The next potential resistance level is near the previous highs, around $98-$100.
Trend Analysis:
The stock appears to have been in a downtrend prior to this breakout, as indicated by the downward sloping moving averages and the series of lower highs and lower lows. The breakout could signify a potential trend reversal, particularly if the price stays above the previous resistance level and continues to close above the moving averages.